MacKenzie Angeledes
Introduction:
This testing report is for the rear suspension project for the Central Washington University Electrathon Vehicle. The requirements of the project require that the suspension allows a minimum of 3 inches of travel at the driven rear axle relative to the ground or horizontal reference surface (for example, the lower bars of the vehicle frame). The parameters of interest in this requirement include an application of force to the vehicle axle causing the coil-over shock to be compressed, allowing travel of the axle. Predicted performance, as calculated in the complete project report, the approximate maximum travel under a full shock loading is 6.89 inches (full compression of the shock). Data will be acquired by way of a tape measure and weighted applied loads to the vehicle. Testing for this experiment will occur during the weekend of April 9th 2016.
For Test 2:
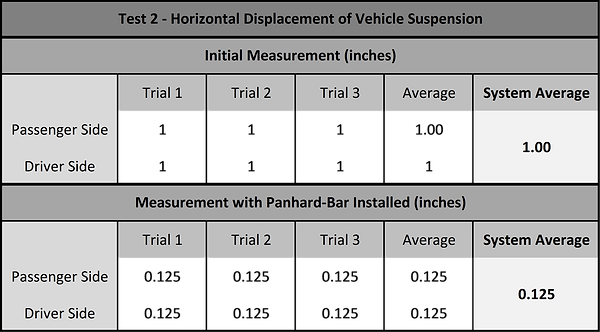
The system, as noted during testing of the suspension travel, has a tendency to travel left-to-right (horizontally) in excess. Initial values measured are shown to be 1 inch. After the values for horizontal travel are collected, a Panhard-bar will be created to tie the system together and limit horizontal movement. The goal is to reduce the movement by 50% - or 0.5 inches. Testing for this experiment will occur during the weekend of April 23rd 2016.
Method and Approach:
Resources for this test will be personal equipment provided at no cost. The data, as mentioned above, will be collected by tape measure. Equipment includes ratcheting straps, jack stands, a hydraulic vehicle jack (to apply force), and miscellaneous other tools as needed.
The frame will be fixed using ratcheting straps and jack stands, and a hydraulic vehicle jack will be used to apply force to the vehicle axle to simulate a load. To ensure that the shocks will not fail, a maximum of force of 700 lb per shock will not be exceeded.
While this is not a particularly precise experiment, it will be an accurate representation of what the suspension system is capable of. A simulated vertical load will be similar to what the vehicle would experience under real-world competition settings. Data will be collected by hand using a tape measure, and then recorded into a spreadsheet using Microsoft Excel where it can be stored, manipulated, and analyzed.
For Test 2:
Resources for this test will be personal equipment provided at no cost. The data, as mentioned above, will be collected by tape measure. Equipment includes jack stands, planks of wood, and a tape measure or ruler.
The frame will be suspended under the front of the frame by jack stands, and human weight will be used to apply force to the vehicle axle to simulate a horizontal load. While this is not a particularly precise experiment, it will be an accurate representation of what the suspension system is capable of with and without a Panhard-bar. Data will be collected by hand using a tape measure, and then recorded into a spreadsheet using Microsoft Excel where it can be stored, manipulated, and analyzed.
Test Procedure:
Testing is scheduled to occur during the weekend of April 9th 2016. It will take approximately 2 hours and will be performed in a personal garage in Auburn, Washington. Please note that the Gantt chart shown below has the schedule slated for 6 hours for each test. However, barring any unexpected failures, the actual experiment will take appreciably less time.
-
Fix the vehicle frame in place by way of ratcheting straps.
-
Position vehicle jack under the axle of the vehicle (use wood blocks as necessary to safely position jack and axle).
-
Take initial measurement of axle relative to the horizontal reference point (ground or vehicle frame horizontal bar).
-
Apply force to the axle by using the vehicle jack.
-
Take measurement of axle relative to the horizontal reference point.
-
Repeat as necessary until maximum displacement is achieved.
In order to ensure safety of the test operators, personal protective equipment (safety glasses, gloves, etc.) will be in place. Potential failures could result in flying pieces, though the nature of the experiment should ensure that there are no failures.
For Test 2:
Testing is scheduled to occur during the weekend of April 23rd 2016. It will take approximately 2 hours and will be performed in a personal garage in Auburn, Washington. Please note that the Gantt chart shown below has the schedule slated for 6 hours for each test. However, barring any unexpected failures, the actual experiment will take appreciably less time.
-
Suspend the front of the frame using two jack stands.
-
Apply a force horizontally to the frame causing a horizontal deflection in the initial direction
-
Take initial measurement of the frame relative to a vertical reference point (upright bars of the frame)
-
Apply a force in the opposite direction
-
Take measurement of horizontal travel to the vertical reference point.
-
Repeat as necessary until displacement is recorded.
-
Repeat process using a Panhard-Bar installed on the suspension system.
In order to ensure safety of the test operators, personal protective equipment (safety glasses, gloves, etc.) will be in place. Potential failures could result in flying pieces, though the nature of the experiment should ensure that there are no failures.
Deliverables:
The maximum horizontal axle travel is calculated to be 6.89 inches. The actual value was determined to be 4.5 inches when the vehicle frame bottomed out. This is a difference of 2.39 inches. However, it exceeds the required value of 3 inches by 1.5 inches. This meets the success criteria outlined in the full project report.
To conclude, the purpose of this test was to determine the horizontal displacement of the rear axle of the electric vehicle when under an applied load.
For Test 2:
The horizontal travel measured without the Panhard-bar was measured as 1 inch. To meet the goal of a 50% reduction in travel, the measured distance for a successful trial was calculated to be 0.5 inches. After installing the Panhard-bar onto the system, the measured distance was less than 0.125 inches. This is a 97% reduction, indicating success. The actual measured distance may have been less, but the amount of movement was not measurable – indicating less than one-eight inch of movement
To conclude, the purpose of this successful test was to determine the horizontal displacement of the suspension system with and without a Panhard-bar.